Executive Summary
The City claims it can accommodate 14,783 units, but a more realistic estimate is 9,941, and the primary drivers of this discrepancy are:
- The City’s false assumption that 100% of pending projects will be built out by 2031 when historical data shows a third of pending units fail to be built in eight years.
- The City assumes, without evidence, that development rates will double in the El Camino Precise Plan and triple in the East Whisman Precise Plan.
To maintain the commendable 33% No Net Loss buffer that the City Council and Planning Commission approved, the City should rezone for an additional 4,842 units.
Table 1. Site Capacity Analysis Breakdown
| MV Planning Analysis, Draft | MV YIMBY Analysis | Difference | ||
| Approved Projects | LI[^1] Units | 379 | 379 | 0 |
| All Units | 2,272 | 2,272 | 0 | |
| Pending Projects | LI Units | 1,896 | 1,260 | -636 |
| All Units | 6,913 | 4,595 | -2,318 | |
| Opportunity Sites[^2] | LI Units | 3,240 | 1,711 | -1,529 |
| All Units | 5,502 | 3,015 | -2,487 | |
| ADUs | LI Units | 48 | 30 | -18 |
| All Units | 96 | 59 | -37 | |
| Total | LI Units | 5,563 | 3,380 | -2,183 |
| All Units | 14,783 | 9,941 | -4,842 |
Appendix
Table 1 summarizes our findings for the following three sources of inventory capacity:
- Pending projects
- Opportunity sites
- ADUs
In this appendix, we analyze each category with data and present our findings.
A: Pending Projects Capacity
Table A1. Pending Projects Capacity Analysis Breakdown
| Mountain View Planning Analysis, Draft | MV YIMBY Analysis | Difference | |
| Low Income Units | 1,896 | 1,260 | -636 |
| All Units | 6,913 | 4,595 | -2,318 |
Despite the City’s remarkable claim that approved and pending projects alone accommodate 82% of the City’s RHNA, the Draft does not attempt to demonstrate why these units will be built within the planning period. Indeed,** the City effectively assumes that 100% of pending projects will be built within eight years**.
HCD’s Site Inventory Guidebook plainly states that, to count pipeline capacity towards a city’s RHNA, the city “must demonstrate” that units in pending projects “can be built within the remaining planning period.”1 HCD has already enforced this guideline for other cities.2
It is possible that the City failed to provide this required analysis because the City changed its permit tracking system in 2017 and so was unable to easily generate a consistent dataset to analyze historical trends over an eight-year period. Mountain View YIMBY overcame this data challenge by using the Wayback Machine to access the City’s Planning Division Update for June 2014.3 This document lists in-progress development projects ranging from a 2-unit single family lot-division project to block-scale apartment complexes. In other words, it provides a snapshot of the pipeline as it existed eight years ago.
To estimate how many pre-planning-approval pipeline units will be built by 2030, Mountain View YIMBY analyzed how many pre-planning-approval pipeline units from June 2014 have been constructed as of June 2022. This provides us with the most recent data possible to analyze the eight-year throughput of the City’s pipeline. We find that 66% of such units are built within eight years. The remainder were delayed, denied, or abandoned. We also find a correlation coefficient of -0.15 between the size of the project and whether the project was built, which notably implies that large projects are somewhat less likely to be built on time, if at all. Using the historical discount factor of 34% for pending projects,4** the pending projects capacity is overstated by 2,318 units, of which 636 are low income units. **
Mountain View YIMBY’s methodology is generous to the City. We have not:
discounted the pipeline capacity by the probability that approved projects with planning permits will not get built within eight years.5
adjusted for large projects’ lower completion rate.
excluded projects asserted to be pipeline projects in the Housing Element Draft that are not listed in the City’s June 2022 Planning Division Update.6 We anticipate that the City will assert there are site-specific reasons to believe that history is not informative for the current pipeline. HCD should err against such assertions given that this analysis was not available prior to the comment period.
A Note on the North Bayshore Master Plan
The largest component of the pipeline, accounting for 3,365 units, is the North Bayshore Master Plan, which is woefully under-analyzed in the current draft.
In addition to ignoring HCD’s guidance that jurisdictions must justify assumptions about the extent to which pending projects like the North Bayshore Master Plan will be built within RHNA6, the City’s draft also ignores HCD’s guidance that to claim residential capacity for Specific Plans or Master Plans, the City should describe “necessary approvals or steps for entitlements for new development (e.g. design review, site plan review, etc.). Describe any development agreements, and conditions or requirements such as phasing or timing requirements, that impact development in the planning period.”7 Indeed, it would be difficult for the City to complete this analysis because the City has not publicly disclosed or voted on the Development Agreement (DA) for North Bayshore.
The City neglected to disclose and analyze potential roadblocks to development at North Bayshore such as:
whether and on what terms the City will approve a DA for North Bayshore.
whether the City will reject construction of a parking structure at City-owned Lot C, which is needed to serve Google’s office development. Because of the financial logistics of this master plan, blocking the office development will block the residential development, and blocking the parking structure could block the office development. This issue is especially challenging, as the City received a letter of intent from the non-profit Grapevine Development to build 100% BMR housing at Lot C, pursuant to the Surplus Land Act, which may incline the City to disapprove parking at Lot C.8
whether the project will exceed the City-imposed vehicle trip cap, which has been made more likely after the City canceled a contract for a reversible bus route to Shoreline. Exceeding the trip cap would halt office building permits, which would again hold up the residential component of the project.
whether the City will make the project infeasible during any discretionary check-in hearings that the City Council has asked to be added to the DA.9
whether the Mountain View Whisman School District, at any point in the next eight years, taxes these units into financial infeasibility, as the school district has already studied doing with a Mello-Roos style tax.10
whether broader market conditions (such as rising interest rates, the decline of the office real estate market, or inflation) reduce the financial feasibility of the project.
whether any foreseeable delays occur as the developer decants office space, including non-standard spaces like labs that require additional care to decant.
This is an extremely complicated master plan with many moving parts, from transportation infrastructure to office to housing components that could all pose a delay. The City should have disclosed and analyzed these roadblocks, and committed to additional measures to remove these obstacles from blocking development in North Bayshore.11 As Table 53 indicates, North Bayshore’s land dedications will occur, absent delays, in 2026 and 2029, and construction will take up to two additional years after that. For these units to count towards RHNA6, there is zero room for delay.12
A Note on Land Donations
HCD has the discretion to evaluate whether future land dedications constitute pending projects. The City’s implicit view is that an affordable housing project can be pending even when no developer exists, no RFP has been issued, and the land may not be donated until 2029, as with Phase 2 of North Bayshore’s land dedication. We submit that these are not pending affordable housing projects; these are opportunity sites.13
B: Opportunity Sites
Table B1. Opportunity Site Capacity Analysis Breakdown
| Mountain View Planning Analysis, Draft | MV YIMBY Analysis | Difference | |
| Low Income Units | 3,240 | 1,711 | -1,529 |
| All Units | 5,502 | 3,015 | -2,487 |
Table B2. Historical Record vs City’s RHNA6 Assumptions, Broken Down by Precise Plan.
| Projects per Year (Historical) | Projects per Year (City Claims for RHNA6) | Increase | |
| East Whisman | 0.67 | 1.88 | 181% |
| El Camino | 3.13 | 6.88 | 120% |
| North Bayshore | 0.40 | 0.75 | 88% |
| San Antonio | 0.88 | 1.13 | 29% |
Table B3. Opportunity Sites (No Rezoning), by Precise Plan.14
| MV Planning Analysis, Draft | MV YIMBY Analysis | Difference | ||
| Downtown | LI Units | 0 | 0 | 0 |
| All Units | 6 | 6 | 0 | |
| East Whisman | LI Units | 997 | 354 | -643 |
| All Units | 1,312 | 466 | -846 | |
| El Camino | LI Units | 1,283 | 583 | -700 |
| All Units | 2,530 | 1150 | -1,380 | |
| North Bayshore | LI Units | 313 | 167 | -146 |
| All Units | 405 | 216 | -189 | |
| San Antonio | LI Units | 182 | 142 | -40 |
| All Units | 325 | 253 | -72 | |
| Not in Precise Plan | LI Units | 0 | 0 | 0 |
| All Units | 120 | 120 | 0 | |
| Total | LI Units | 2,775 | 1,246 | -1,529 |
| All Units | 4,698 | 2,211 | -2,487 |
To construct Table B2, Mountain View YIMBY used HCD’s dataset on building activity sourced from APRs, dated 2018 or later.15 To include pre-2018 data, Mountain View YIMBY combined HCD’s dataset with MTC’s dataset on Mountain View permits approved from 2014 to 2017.16
While valuable, pre-2018 data will overestimate the viability of housing in these precise plans, as pre-2018 projects predate the Palmer Fix, after which Mountain View added a costly 15% inclusionary requirement for rental housing. Mountain View then extended the Palmer Fix to ownership housing. Because pre-Palmer Fix projects had much more modest fees, pre-2018 data will yield site capacity estimates that are generous to the City. Nowadays, housing is less financially viable, as the City’s own economic analysis in Appendix H indicates that inclusionary requirements are the biggest constraint to housing.
Compared to data from 2014 to 2021, we find that, in effect, the City assumes that housing accommodated across four major precise plans will, on average, double.
This is an obvious byproduct of the fact that the City does not provide substantial evidence that existing uses pose no impediment to residential development. And the site inventory is full of existing uses that undermine the City’s claim that these are underutilized sites.
The City must provide substantial evidence that existing uses pose no impediment to development of inventory sites within eight years. The City argues that AB 1397 does not require this analysis of the City because non-vacant ‘developable sites’ and non-vacant ‘rezone opportunity sites’ only accommodate 47% of the City’s lower income allocation. There are two problems with this claim.
First, the City inexplicably ignores that non-vacant pipeline sites are non-vacant sites. Because the pipeline contains few vacant sites, the City accommodates the vast majority of low-income units on non-vacant sites, whether they be non-vacant pipeline sites or non-vacant opportunity sites. This thus triggers AB 1397’s requirement that, if nonvacant sites accommodate the majority of the City’s lower income allocation, the City “shall demonstrate that the existing use” of sites do “not constitute an impediment to additional residential development during the period covered by the housing element.”17
Second, we can turn to the City’s formula in Table 45 for calculating the “Total Capacity (not related to non-vacant sites).” To repeat the point in the above paragraph, we take issue with this formula because it fails to count non-vacant pipeline sites as non-vacant sites. Even still, given Mountain View YIMBY’s analysis of pending projects, this formula implies the City accommodates 61% of low income units on non-vacant sites.18 Thus, even on the City’s questionable reading of AB 1397, the City would still have to provide substantial evidence that existing uses pose no impediment to development on non-vacant sites.
Such a case would be hard to make. The inventory as of March contained over a hundred businesses and offices, and the City presents no evidence that these businesses will be discontinued by 2031.1920 This task is made all the more difficult by the fact that the City continues to include sites with landowners known to be uninterested in development, including 384 San Antonio, 2633 California, and 1288 El Camino Real. In February 2022, an experienced residential developer, Mircea Voskerician, reached out to landowners of several inventory sites about their interest in residential development, and he found landowners were uninterested in housing at the aforementioned locations. In a March letter to the City Council, Mountain View YIMBY relayed this information regarding 384 San Antonio and 2633 California, only for the City to ignore the public comment.21
On a precise plan by precise plan basis, Mountain View YIMBY adjusted the City’s capacity claims to account for the actual development trends in these precise plans, and we find the City has overestimated how much housing these four precise plans can accommodate by 2,487 units, of which 1,529 units are low income. These findings are included in Table B3, which generates our bottom line summary presented in Table B1.
Recycled Sites
On page 215, the City notes that seven “prior Housing Element sites” have been “rezoned since the 5th cycle, which allow them to be included in the 6th cycle inventory as new sites.” The City fails to mention that these sites were rezoned concurrently with the adoption of the housing element for RHNA5, _nearly eight years ago. _None of these sites have accommodated housing in that time, and the City presents no case for projecting a different outcome during this planning period. Together, the City asserts these seven sites accommodate 530 units of housing, of which 333 are low income.
C: ADUs
Table C1. ADU Capacity Analysis Breakdown
| Mountain View Planning Analysis, Draft | MV YIMBY Analysis | Difference | |
| Low Income Units | 48 | 30 | -18 |
| All Units | 96 | 59 | -37 |
Here is the City’s own data for ADU construction in previous years:
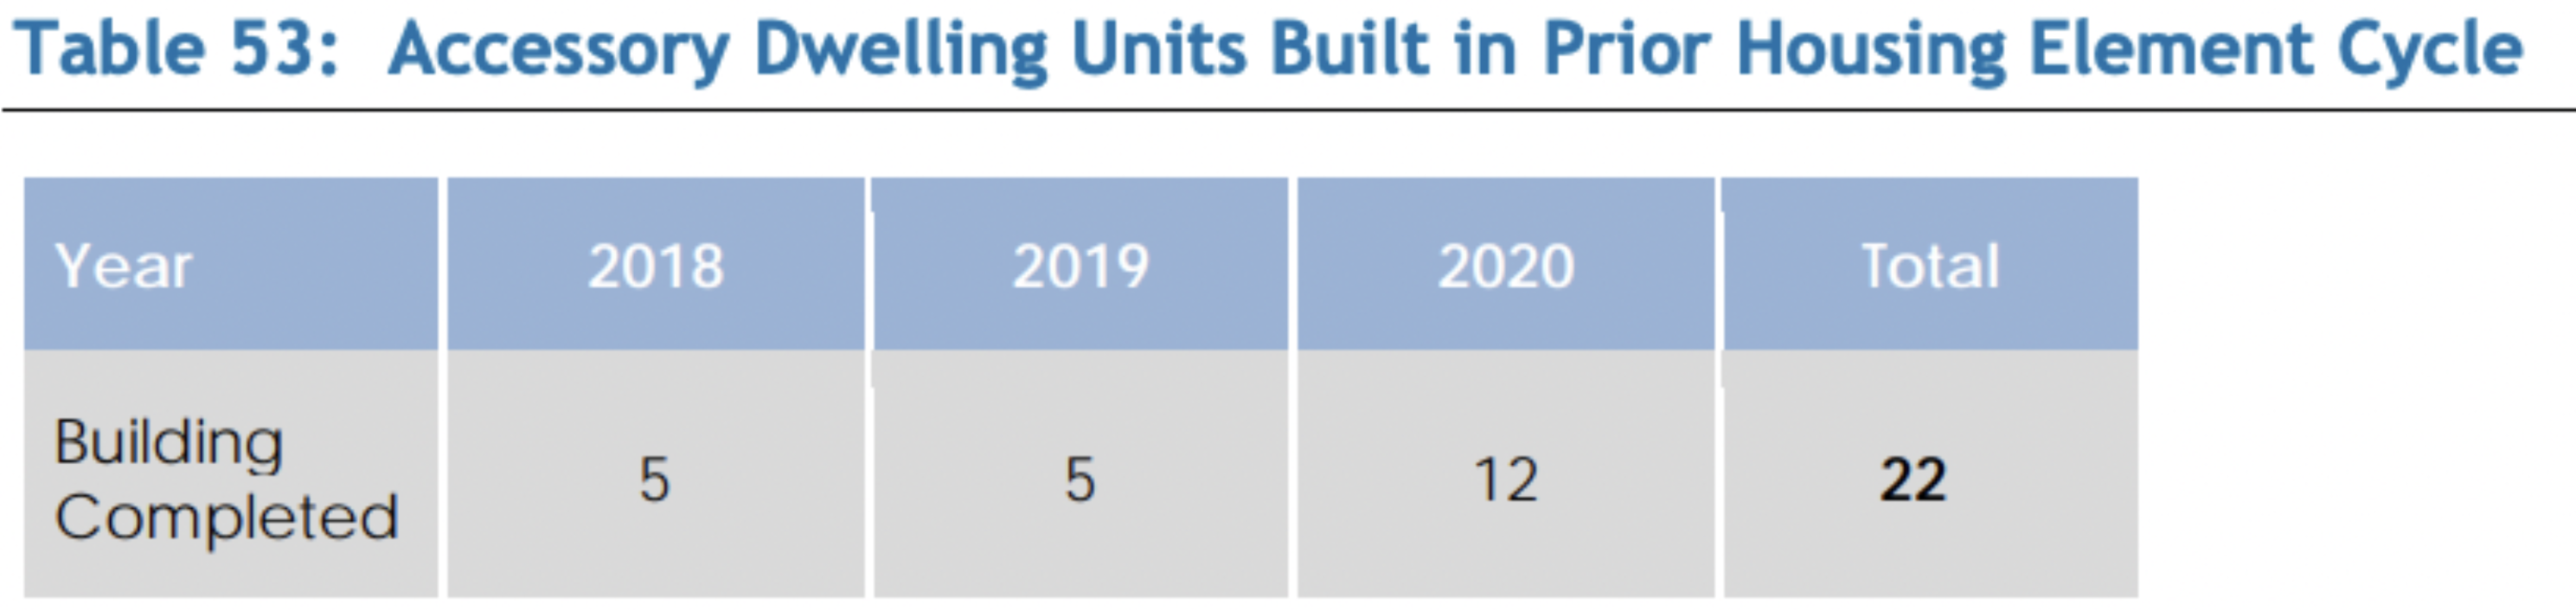
Forward-looking calculations of the number of ADUs to be constructed must be
“based on the number of accessory dwelling units developed in the prior … planning period” and “other relevant factors.” (Gov’t Code § 65583.1(a).)
Despite this, the City bases its ADU estimates on 2020’s numbers alone. The City says this 2020 rate will continue to be achieved by “expanding policies and programs”, but it’s unclear which policy or program is being referred to. No clear evidence is given to support the claim that 2020 will be the norm going forward rather than 2019.
We believe the City should use HCD’s safe harbor estimate of taking the average of data available starting in January 2018, which implies an average of 7.3 ADUs are constructed per year.22
Notes
LI is an acronym for ‘lower income.’
We use ‘opportunity sites’ to denote ‘Developable Sites’ and ‘Rezone Opportunity Sites’ listed in Table 40.
Page 6 of HCD’s guidebook on the site inventory: https://www.hcd.ca.gov/community-development/housing-element/docs/sites_inventory_memo_final06102020.pdf ↩︎
See HCD’s response letter to Culver City, dated April 21, 2022, requiring “supporting evidence” for the city’s conclusory assertion that “all [approved and pending] projects are expected to be permitted in the eight-year planning period.” https://www.hcd.ca.gov/community-development/housing-element/docs/lanculvercityadoptedout042122.pdf ↩︎
https://web.archive.org/web/20140709150825/http://mountainview.gov/civicax/filebank/blobdload.aspx?BlobID=13170 ↩︎
For this analysis, we assume that approved projects are projects where planning permits are approved, and pending projects are projects where planning permits are not approved. The Draft’s statement that ‘Approved Projects are those where an application has been approved’ (page 259) does not specify whether an “application” is for a building permit or a planning permit. However, Table 47’s list of approved projects includes projects where no building permit has been issued, e.g. Lot 12. Thus, we assume approved projects are those where planning permits are approved, and all pending projects are pre-planning-approval. ↩︎
Consider, for instance, 415 E. Middlefield. This project is among the largest proposed in the East Whisman Precise Plan, but the project was made financially infeasible and so was abandoned after being permitted. ↩︎
Our assumption is that these excluded projects are, at best, being informally discussed with the City (and therefore more speculative) than projects contained in the June 2014 or June 2022 Planning Division Updates. The excluded projects are 1991 W El Camino Real and 615-749 W El Camino Real, and together they account for 353 units. See the June 2022 Planning Division Update here: https://www.mountainview.gov/civicax/filebank/blobdload.aspx?BlobID=37910 ↩︎
See page 18 of HCD’s guidebook on the site inventory: https://www.hcd.ca.gov/community-development/housing-element/docs/sites_inventory_memo_final06102020.pdf ↩︎
See page 11 of: https://mountainview.legistar.com/View.ashx?M=AO&ID=119731&GUID=dfdce090-faf2-48bc-8519-08c254ef261d&N=Q291bmNpbCBRdWVzdGlvbnM%3d ↩︎
Specifically, last December, City Council asked staff to “explore options to incorporate updates to project requirements in the Master Plan through the timeline of the Development Agreement” (page 7). The meeting minutes are available here: https://mountainview.legistar.com/MeetingDetail.aspx?ID=817172&GUID=68CE128A-0D73-44ED-9531-6A85B7AF71F8&Options=&Search= ↩︎
See Mountain View Voice’s March 2022 article entitled, “School district considers tax measure that city fears could jeopardize housing growth.” https://www.mv-voice.com/news/2022/03/09/school-district-considers-tax-measure-that-city-fears-could-jeopardize-housing-growth ↩︎
The same can be said for the Middlefield Park Master Plan, which requires similar discretionary actions from City Council. If the City prefers to keep its options open on delaying, adding costs to, or blocking housing in Middlefield Park, the City should not portray Middlefield Park as a done deal to HCD. Or if it is a done deal, then discretion is moot and should be jettisoned. ↩︎
Indeed, the current schedule of actions is likely insufficient, as it is. While a sort of perfunctory schedule is sketched out in Table 53, the analysis should be more extensive given the extent to which the City relies on these projects to accommodate its RHNA. Additionally, the timelines extend quite far into RHNA6. See HCD’s April 12, 2022 letter to Bell, in which HCD encourages the City to reach out to developers within 2 years of adopting the housing element. See HCD’s September 3, 2021 letter to Chino Hills, in which HCD requires “a schedule of actions (e.g., zoning, requests for proposals, developer selection, expedited permit processing and funding).” HCD’s April 12, 2022 letter to Pomona is substantially similar. ↩︎
Again, we use ‘opportunity site’ differently from how the City uses it in the draft sent to HCD. As we use the term, and as the City itself used the term in the draft published for the public comment period, pending projects are not opportunity sites. ↩︎
Compare with Table 55 of the Draft. ↩︎
See the downloadable excel spreadsheet labeled ‘Table A2 (Annual Building Activity Report Summary – New Construction, Entitled, Permits and Completed Units)’. https://hcd.ca.gov/apr-data-dashboard-and-downloads ↩︎
See ABAG + MTC’s dataset here: http://housing.abag.ca.gov/#permits ↩︎
https://leginfo.legislature.ca.gov/faces/billPdf.xhtml?bill_id=201720180AB1397&version=20170AB139791CHP ↩︎
We show our work in this footnote. Given the City inflates the capacity of pending projects by 636 low income units, the figure labeled “Total Capacity (not related to non-vacant sites)” should be 2,323 - 636 = 1,687. Thus, the figure “RHNA on Non-vacant Sites” should be 4,370 - 1,635 = 2,683 low income units, meaning that 61% of low income units are accommodated on non-pipeline, non-vacant sites. ↩︎
Mountain View YIMBY manually counted all existing offices and businesses because the City did not disclose the number of businesses with potentially distinct leases per parcel. Due to the tediousness of tabulating this count, we did not update this number for the July release. We encourage the City to measure this metric themselves. Some parcels in the inventory include over a dozen businesses, and this is useful information for the City to consider if the City intends to argue this poses no impediment to accommodating housing. ↩︎
Some of these parcels are seeing active refurbishment of the existing use, as with the Lozano Car Wash on 2690 W. El Camino. ↩︎
See this public comment letter from March on page 6: https://mountainview.legistar.com/View.ashx?M=AO&ID=115391&GUID=cfb7c739-4b47-4253-a679-c87c85bb75ce&N=SXRlbSA2LjEgQ29ycmVzcG9uZGVuY2UgQmF0Y2ggMy5wZGY%3d ↩︎
See page 31 of HCD’s Site Inventory Guidebook. https://www.hcd.ca.gov/community-development/housing-element/docs/sites_inventory_memo_final06102020.pdf ↩︎